5- Attribute Gage Repeatability and Reproducibility Analysis
5.1- Introduction
Dataset come from a process where the quality of the surface are a key for this product
5.2- STEP 1: Get the measurement
[1]:
from pypetb import RnR
import pandas as pd
import matplotlib.pyplot as plt
import seaborn as sns
#set seaborn style to improve the figure sight
sns.set()

# Load measurement dataset
url = 'https://raw.githubusercontent.com/jgherruzo/myFreeDatasets/main/Cube_surface.csv' # noqa
df=pd.read_csv(url,sep=';')
print(df.info()) # In order to check column names
<class 'pandas.core.frame.DataFrame'>
RangeIndex: 60 entries, 0 to 59
Data columns (total 4 columns):
 #   Column       Non-Null Count  Dtype
---  ------       --------------  -----
 0   Pieze        60 non-null     int64
 1   Operator     60 non-null     object
 2   Measurement  60 non-null     object
 3   Reference    60 non-null     object
dtypes: int64(1), object(3)
memory usage: 2.0+ KB
None
5.3- STEP 2: build up the model
[2]:
mydict_key={
  '1':'Operator',
  '2':'Pieze',
  '3':'Reference',
  '4':'Measurement'
}
RnRModel=RnR.RnRAttribute(df,mydict_key)
print(RnRModel.getLog())
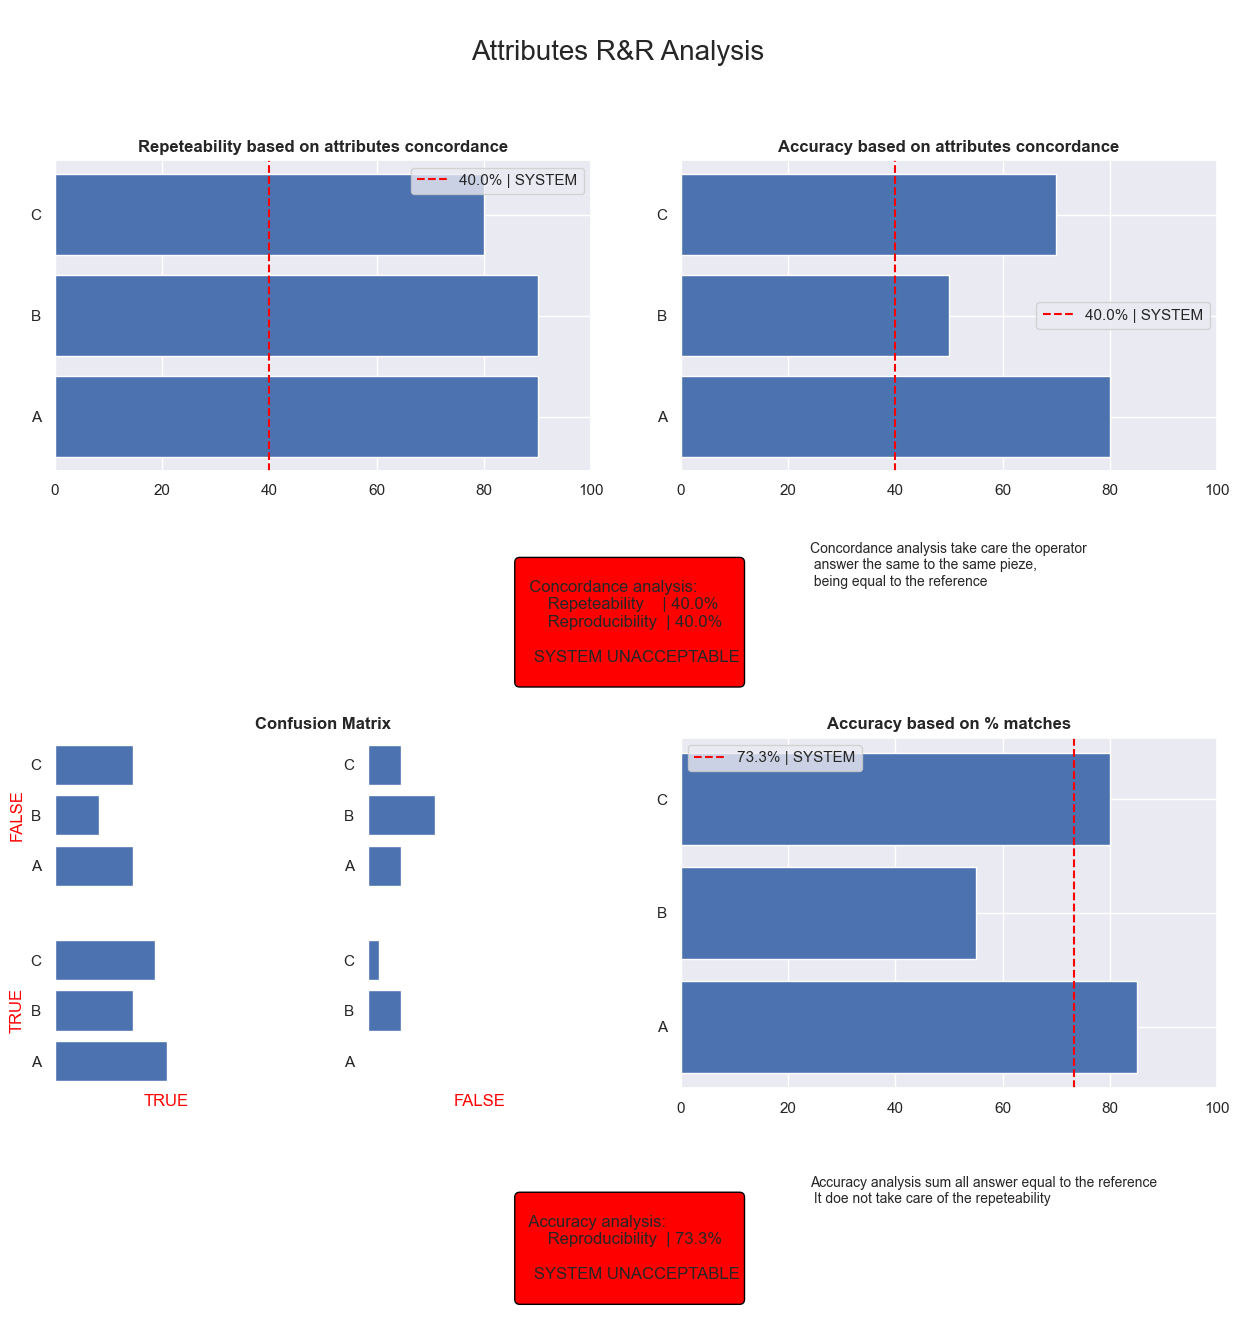
Number of trials per operator: 2
Number of parts: 10
A repeatability: 90.00%
A accuracy: 80.00%
B repeatability: 90.00%
B accuracy: 50.00%
C repeatability: 80.00%
C accuracy: 70.00%
Total repeatability (Concordance of atributes): 40.00%
Total accuracy (Concordance of atributes): 40.00%
System accuracy: 73.33%
A accuracy: 85.00%
B accuracy: 55.00%
C accuracy: 80.00%
Model is created
5.4- STEP 3: Check the report
Attribute Gage RnR report is a summary of chart that complete the log to understand the accuracy of your system
[3]:
RnRModel.Report()
plt.savefig('attributes.png')
[ ]: